3-11-10
Release 3-11-10
WASL Dashboard:
Wasl dashboard is a centralized view to have a real-time overview of vehicles on Wasl, along with some other statistics.
The following widgets composes Wasl dashboard:
- Current vehicles stats (real-time update)
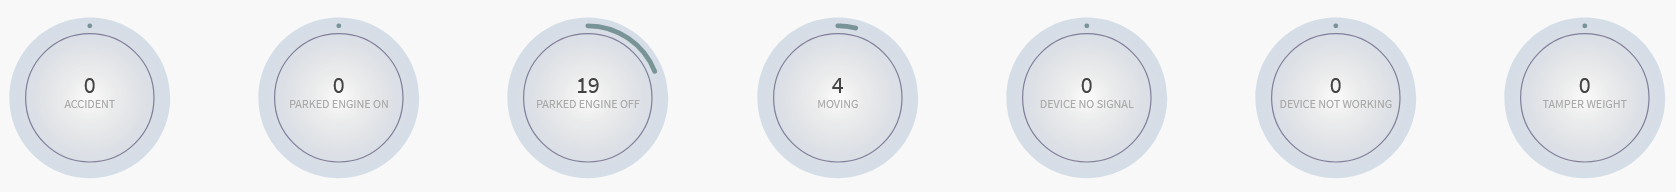
This widget contains 7 cards representing the number of vehicles in each Wasl vehicle state. The states are:
-
- Moving.
- Parked Engine On.
- Parked Engine Off.
- Device No Signal.
- Device Not Working.
- Tempered Weight.
- Accident.
Clicking on any card should load the list of vehicles with that state.
- Vehicles count as per last success update slot
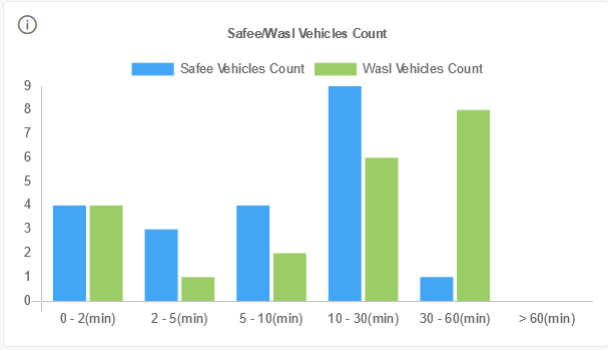
This widget is a double-bar chart, with the following ranges “in minutes”: ([0-2], ]2-5], ]5-10], ]10-30], ]30-60], >60). Each double-bar consists of 2 values:
-
- Safee vehicles count: is the number of vehicles (registered vehicles in Wasl only) that received a GPS update message in the selected time range.
- WASL vehicles count: is the number of vehicles that have successfully sent an update message to WASL in the selected time range.
-
Failed/Success messages count
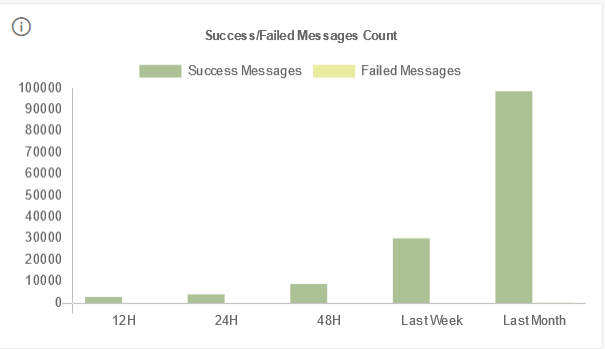
This widget is a double-bar chart, with the following values “in time”: (12H, 24H, 48H, last week, last month). Each double-bar consists of 2 values:
-
- Number of success messages (sent to Wasl gateway) in the selected time range.
- Number of failed messages (sent to Wasl gateway) in the selected time range.
-
Registered number of vehicles to the total vehicles count in the company
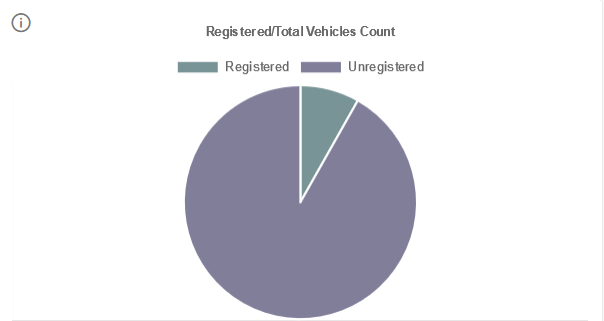
This widget is a pie chart with 2 slices:
-
- Number of registered vehicles in Wasl.
- Number of unregistered vehicles in Wasl.
-
Registered number of drivers to the total drivers count in the company
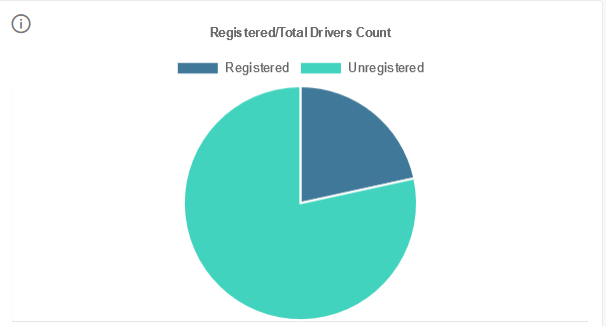
This widget is a pie chart with 2 slices:
-
- Number of registered drivers in Wasl.
- Number of unregistered drivers in Wasl.
-
Wasl events count (in the last 24 hours)
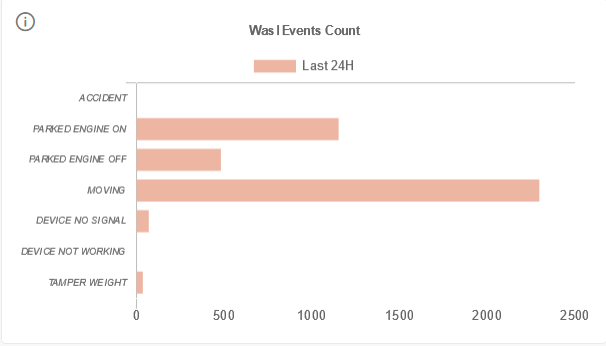
This widget is a bar chart, with each bar represents the count of a WASL state in the last 24 H. The list of states is the same list in the first widget “Current Vehicles Stats”.
- Vehicles count per weight (Real-time update)
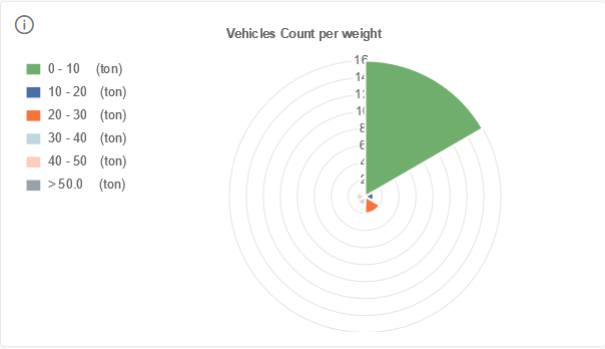
This widget is a radial pie chart, with the following ranges (in tons): (0 “Tampered”, ]0-10], ]10-20], ]20-30], ]30-40], ]40-50], >50).
Each slice represents the number of vehicles with the weight in the selected range. Clicking on any slice should load the list of vehicles with that range.
- Vehicles count per plate type
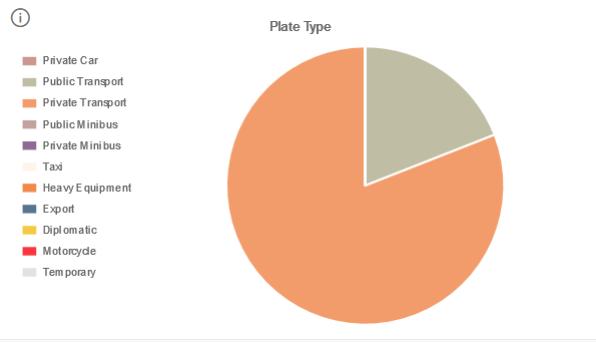
This widget is a pie chart with each slice represents a plate type. Each slice value will be the number of vehicles with the selected plate type.
- Vehicles count per “Device no signal” (in the last month)
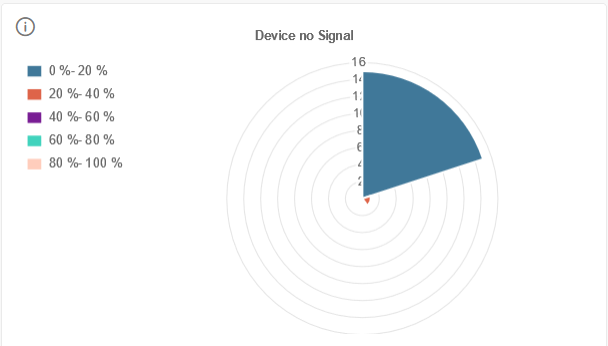
This widget is a radial pie chart, with the following ranges (in percentage): ([0-20], ]20-40], ]40-60], ]60-80], >80).
Each slice represents the number of vehicles that had a percentage of “device no signal” in the past month in the selected range. Example: a vehicle with no signal for 9 days in the past month would have a percentage of 9/30 = 30% falling in the range ]20-40]