4-3-1
Release 4-3-1
This release introduces a new fuel report and some enhancements on other reports and features.
1. Fuel Tracking Dashboard:
For vehicles with fuel module only.
This report helps you surround all fuel information related to your vehicles. Starting from the estimated fuel consumption you set for your vehicles, to the estimated CO2 emission, filling counts/amounts, dropping/ theft counts/amounts, and finally to the real fuel consumption provided by some fuel measuring devices on your vehicles.
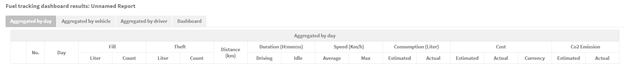
the report output is very rich and comprehensive, it’s divided into three tabs each with a different aggregation base, and a final tab to summarize all information into a constructive dashboard.
the aggregation tabs are as follows:
aggregated by day: it displays daily-basis information; each row represents the information of a day and can be expanded to show the detailed information aggregated by the vehicle. furthermore, each vehicle-based row can be expanded to show the information aggregated by the driver of the vehicle.
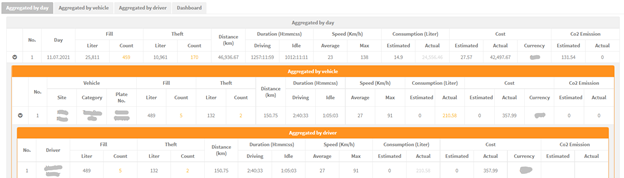
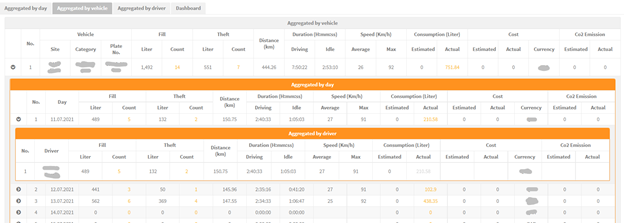
aggregated by vehicles: displays the vehicle-basis information; each row represents the information of a vehicle and can be expanded to show the detailed information aggregated by day. furthermore, each daily-basis row can be expanded to show the information aggregated by the driver of the vehicle.
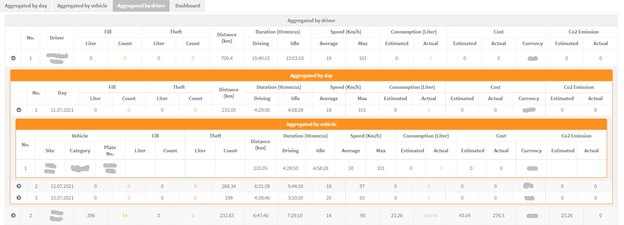
aggregated by driver: displays the driver-basis information; each row represents the fuel information of the vehicles that the driver has driven aggregated by the driver and can be expanded to show the detailed information on each day. furthermore, each daily-basis row can be expanded to show the information aggregated by the vehicles that the driver has driven during the selected time range.
The dashboard tab shows all previous information in comprehensive widgets and charts with the ability of downloading the charts:
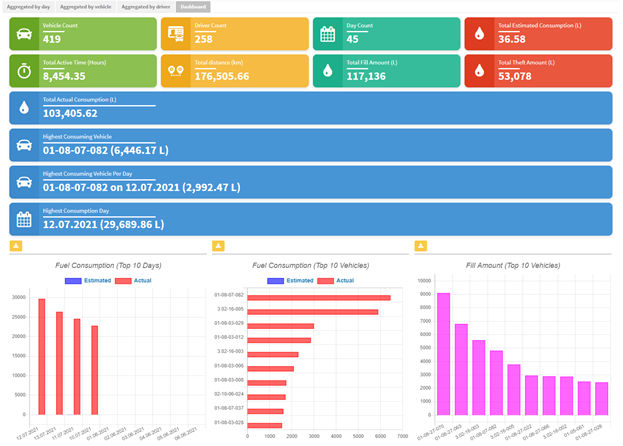
all aggregation tabs display the following information - in accordance with the aggregated item:
1- “Fill” table displays the fuel filling counts and amount done on the selected time range. it’s built based on the fuel fill alarm condition, so you need to make sure that you created the filling alarm condition properly to get the correct results.
2- “Theft” table displays the fuel emptying counts and amounts done on the selected time range. it’s built based on the fuel theft alarm condition, so you need to make sure that you created the emptying alarm condition properly to get the correct results.
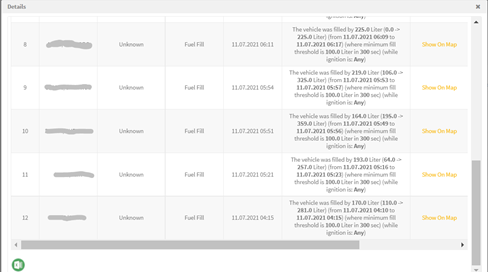
Good to mention here that the displayed number for the count of the fillings/theft is clickable and it shows the fired alarms for the fill/theft operations with the ability of exporting them to an excel file.
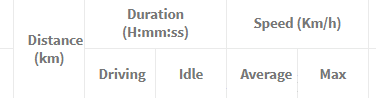
3- Distance column shows the total distance traveled during the selected time range
4- Duration columns show the total driving time and the total idle time for the selected aggregated item.
5- Speed column shows the average speed on the selected time window and the maximum recorded speed.
6- Consumption columns show
a. The estimated fuel consumption that is calculated based on the parameters set in the fuel parameters of the vehicle .
b. The actual fuel consumption that is read from the fuel module which in turn depends on the fuel sensing mechanism mounted on the vehicle.
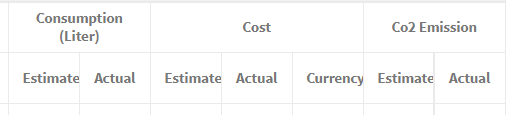
7- Cost columns show the cost calculated based on the “company configurations” of the fuel module configurations and give:
a. The estimated cost value which is the cost of the estimated consumed fuel.
b. The actual cost value which is the cost of the actual consumed fuel.
c. The currency set in the company configurations of the fuel module configurations
8- Co2 Emission columns show
a. The estimated emission value which is calculated based on the parameters set in the fuel parameters of the vehicle.
b. The actual value which is calculated based on the received values from the AVL unit.
Finally, you can export the whole report with its dashboard to an excel file, save it, and create a scheduled report based on it.
2. RAG report enhancements:
We added the seat belt violation to the report output. It shows now the seat belt violation count along with the violation duration.
Another important enhancement is done on the formula used by the report. We provided the RAG report with a new formula to calculate the driver score. We make it possible for the user to choose which formula the report should consider to calculate the score.
For easier use, the two formulas are shows as “Formula A” and “Formula B” at the report input. When you choose your preferred formula, the list of available violations differs as appropriate. Now, let’s clarify the different between the two formulas.
Formula A:
It considers the acceleration, deceleration (hard braking), seatbelt, and overspeed violations to evaluate the drivers’ performance. The overall score is the sum of scores of the above-mentioned violations. The score of each violation is calculated as follows:
Speed Score = (Overspeed Duration / (10 * Distance)) * 100
Seat Belt Score = (No Seat Belt Duration / (10 * Distance)) * 1000
Acceleration Score = (Acceleration Count / Distance) * 100
Deceleration Score = (Deceleration Count / Distance) * 100
Total Score = Speed Score + Seat Belt Score + Acceleration Score + Deceleration Score
According to this formula, the drivers with higher score are the drivers with lower performance. The coloring range of this formula when the four violations are considered is as follows:
0≤Green is for score <1
1≤ Amber is for score <3
Red is for scores ≥3
Formula B:
It considers the seat belt, deceleration (hard braking), and overspeed violations to evaluate the drivers’ performance. The overall score is calculated depending on the following formula:
Total Score = ((Total Mileage/Total Violation)/100) + 65
Where:
Total Violation = seat belt score + over speed score + deceleration score
Seat Belt Score = 0.5 * No Seat Belt Duration
over speed score = 1.6 * over speed counts
deceleration score = 0.25 * deceleration counts
According to this formula, the drivers with higher score are the drivers with higher performance. The score range of this formula when the three violations are considered is as follows:
80≤Green is for score ≤100
66≤ Amber is for score <80
Red is for scores ≤66
The score is 100 when the total violation = 0 and the total mileage is >0
3. SP2000 RAG enhancement:
We added the seat belt violation to the report output. It shows now the seat belt violation count along with the violation duration.
4. Reports’ enhancements:
-
- The “past location” and the “vehicle idle” reports are now provided with the address column.
- The “vehicle driving information” report is now provided with a new column for the total duration of the ignition on state (driving duration + idle duration).
5. Monitoring page on the Mobile app:
Mobile APP will display all vehicles on the map for accounts with less than 50 vehicles.