5-1-3
Release 5.1.3
In this release, we introduce a new report and new features.
- RALG report ==============
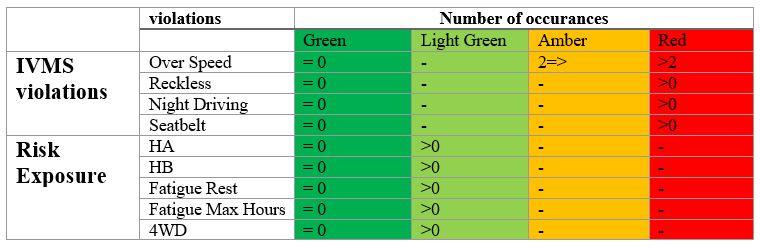
RALG (Red — Light Green-Amber-Green) Report is a key component in the evaluation of the Safety performance of each driver, enabling HSE and Transportation teams to identify at-risk behaviors and critical road violations that might trigger Motor Vehicle Crashes.
drivers coloring depends on the number of occurrences of each violation. The violations are divided into two categories: IVMS violations and Risk Exposure. the coloring logic implies that any occurrence for IVMS violations will move the driver to the red color (except for the overspeed as shown in the below table), while occurrences for risk exposure violations will move the driver to the light green only.
Violations in this report are taken from the following alarm conditions:
-
Over speed violation is built based on “SP 2000” alarms conditions — Overspeed violation alarm.
-
Seatbelt violation is built based on “SP 2000” alarms conditions — seatbelt alarm.
-
HA is built based on “SP 2000” alarms conditions — dangerous acceleration alarm.
-
HB is built based on “SP 2000” alarms conditions — hard braking alarm.
-
Night driving is built based on “out of working hours” alarms conditions.
-
Fatigue rest is built based on “Driver excessive continuous driving” alarms conditions — see Realease 5.0.1.
-
Fatigue max hours is built based on “Driver Excessive Accumulative Driving” conditions - see Realease 5.0.1.
-
Reckless is built based on “SP 2000” alarms conditions — excessive overspeed alarm.
-
4WD is built based on “4WD” alarms conditions.
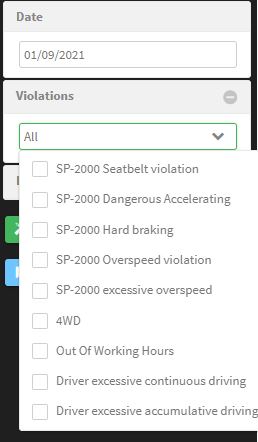
All the above alarm conditions can be selected at the report input to be included /excluded in the report output — as shown below:
This report is built on a monthly basis, that is, you can generate it for one month only.
Now, to check this report, you need to make sure first that the company has the permission to access it, then follow the following steps:
-
Go to reports page.
-
Click on “RALG report”.
-
Choose the driver group or the driver’s name for whom you need the report to be generated.
-
Choose the month on which you need to generate the report.
-
Select the alarm conditions to be considered.
-
Select the driver attributes to be shown.
-
Click on generate.
-
Check the output.
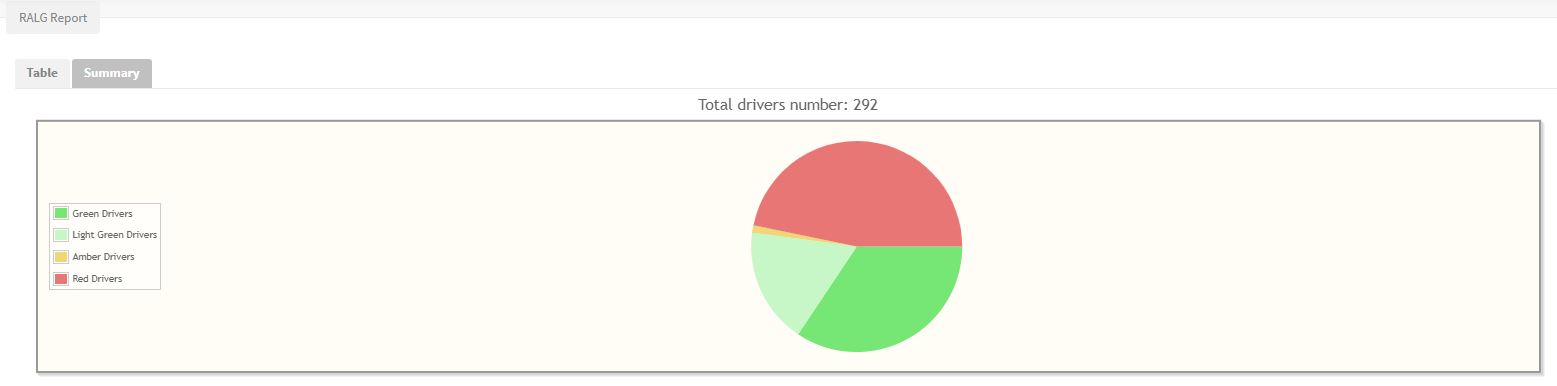
The report output is divided into two tabs, table tab and summary tab. Summary tab shows the results in a pie chart for more comprehension.
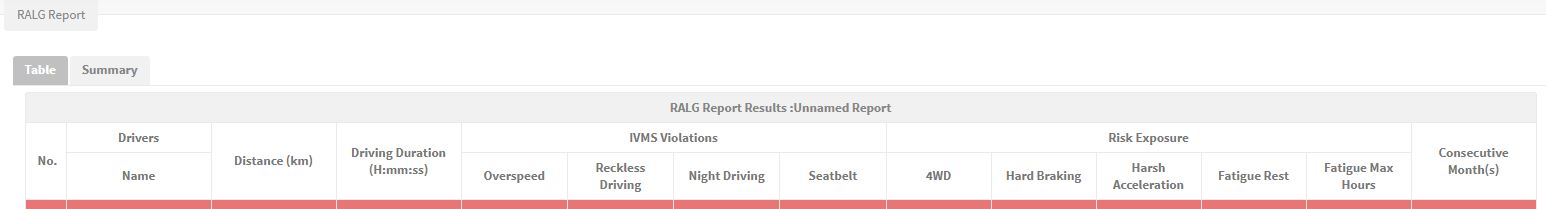
The table tab shows the results as a table containing the drivers’ name along with the distance the traveled during the selected month, the driving duration over this month, the violations, and the number of consecutive months that the driver has the current color.
- Company special logo in exported reports ===========================================
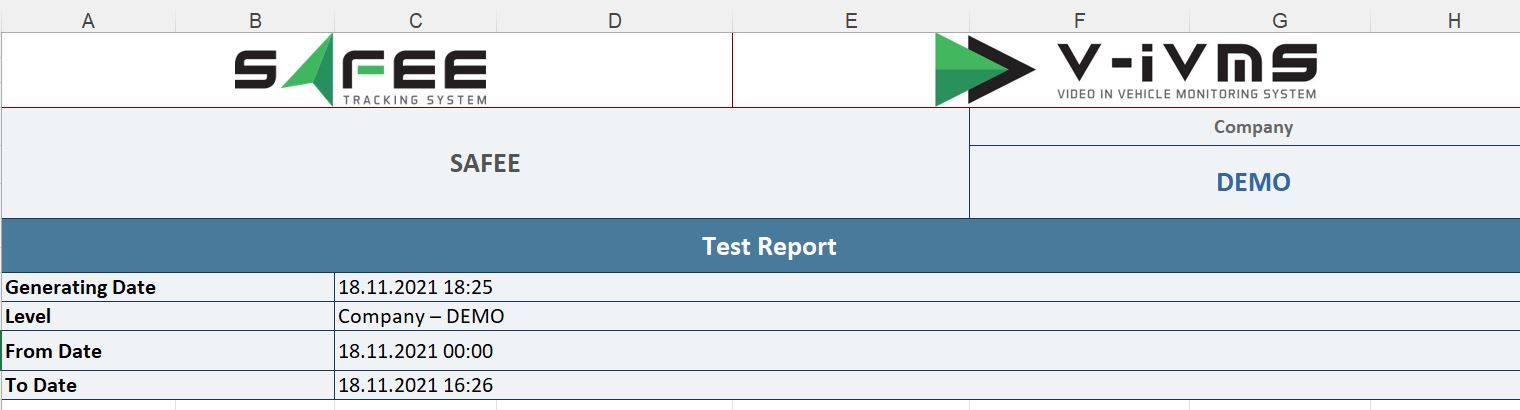
We make it possible to the company admin to add their own logo to the exported reports along with the main partner logo. The header of the exported excel will look like:
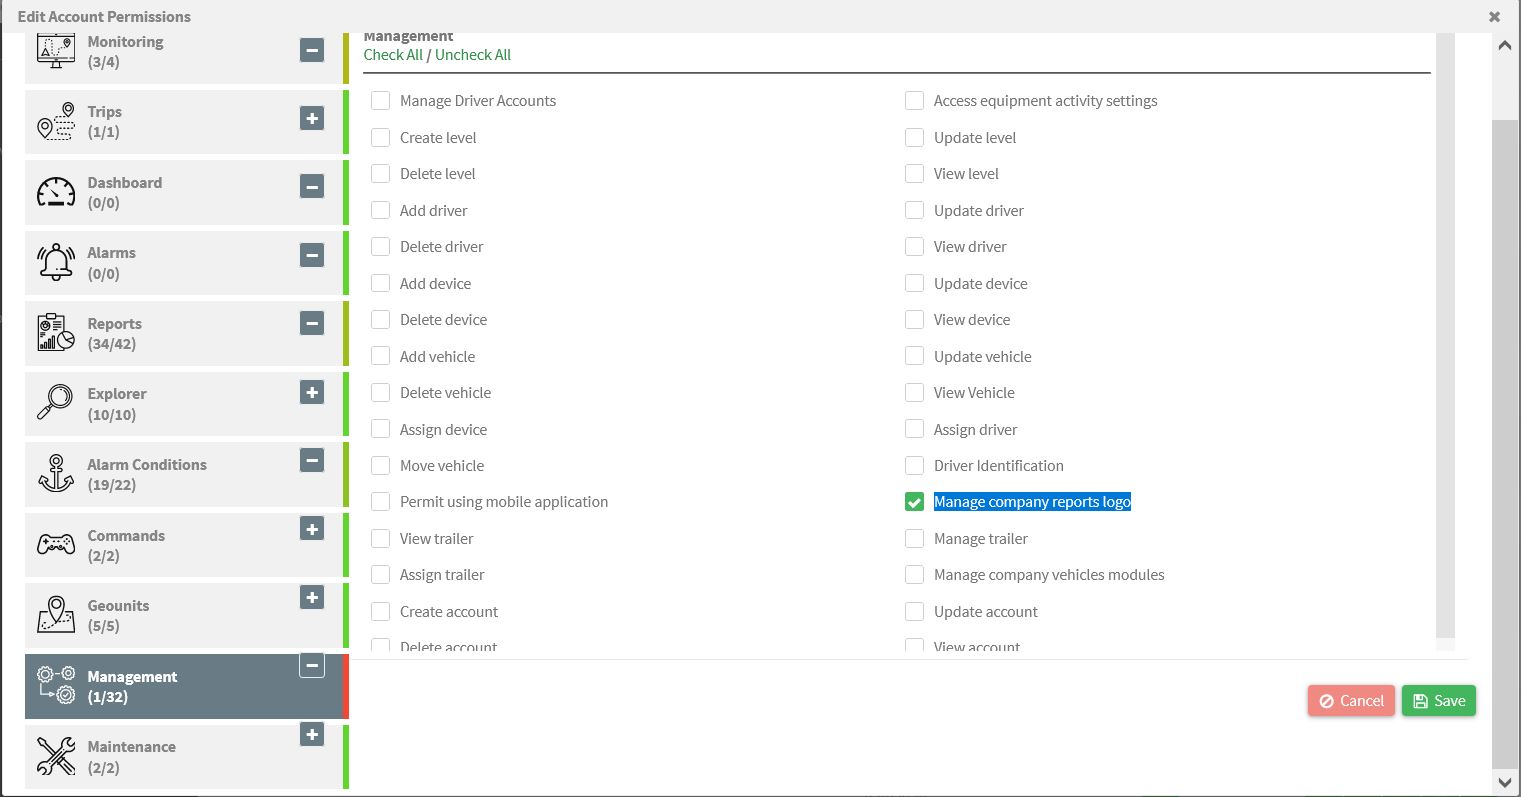
To get advantage of this feature, the company needs to be granted the permission of “Manage company reports logo” from the partner — as follows:
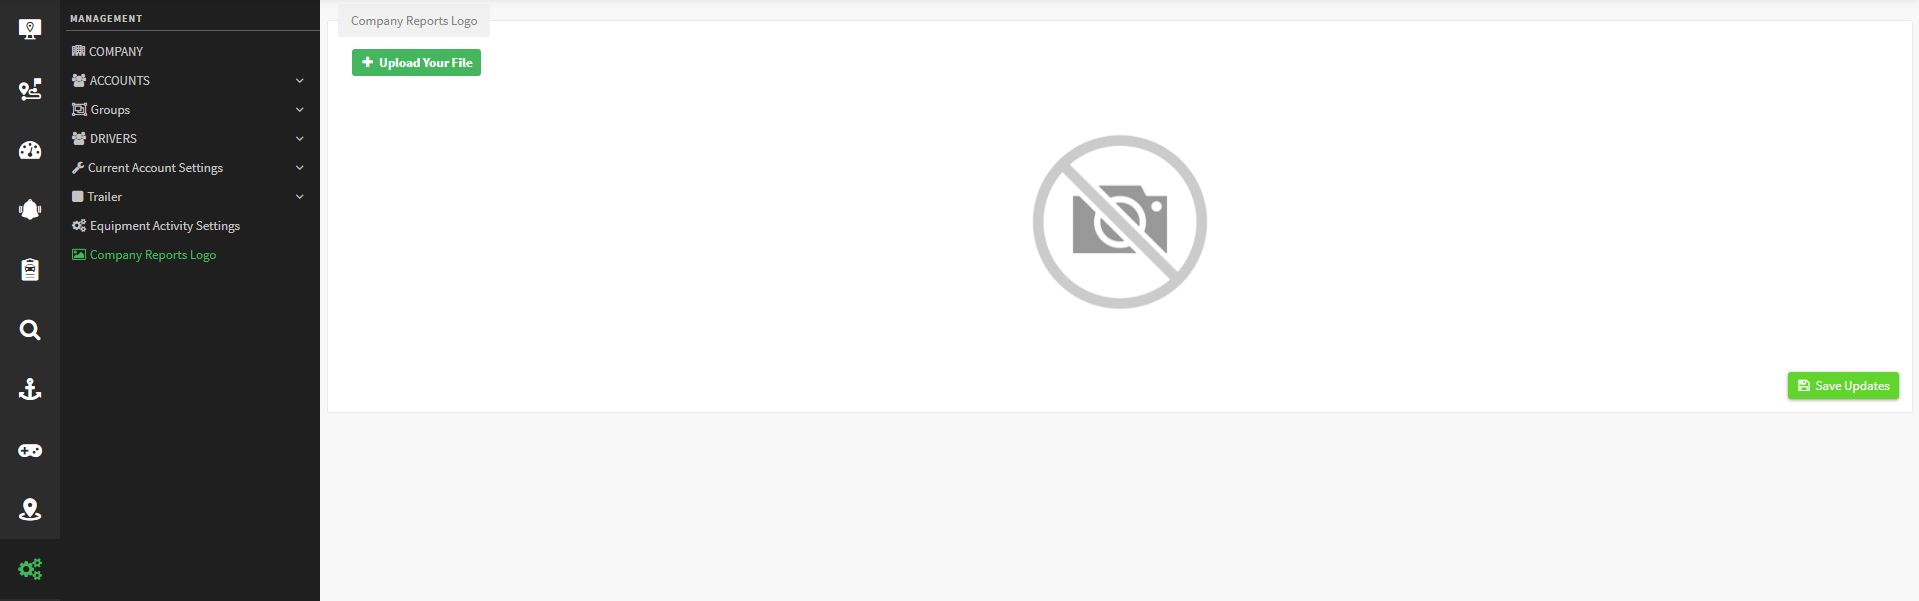
Then, the admin can upload the preferred logo from the management section >> Company Reports Logo, then upload the logo and click on “Save Updates”
- RAG report Enhancement =========================
We made a new enhancement to our RAG report. The enhancement touched the OverSpeeding violations considered in the RAG formula. Now you can include any violation triggered from the alarm conditions “overspeed inside geofence & OverSpeed on road”. all you need to do is to create the alarm condition that suits your needs, then choose the appropriate alarm instance at the report input — as in the following figure:
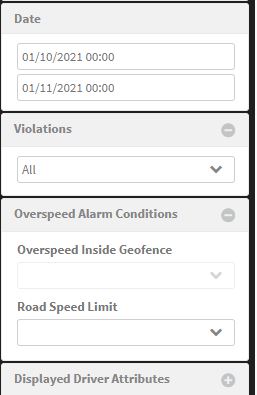
The Overspeed score in the final score will be the sum of the overspeed triggered by the chosen alarm instance and the OverSpeed triggered by the speed limit set in the vehicle properties.
Worth recalling here that when you choose to generate your report “by vehicle”, only the currently assigned drivers will be included in the report output. Whereas, if you generate the report “by drivers”, all drivers’ scores of the chosen driver group will be shown