6-2-0
Release 6.2.0
- Google Map Heatmap:
We are glad to introduce a new feature that enables you to track the locations of a huge number of vehicles over a relatively wide time range efficiently and with high performance. This is done via the new heatmap we integrated into our platform. Now it’s easier to track the movement intensity across areas which notably supports the fleet managers with their decisions. The point is to show the intensity of the geographical data recorded in each place represented with colors to get an idea of what the most visited locations by the vehicles are and how often they are being visited.
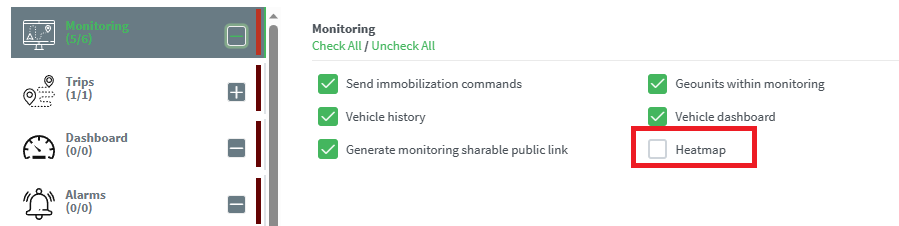
This feature is controlled by a permission under the monitoring page permissions
Once the permission is granted, a new icon will appear on the map on the monitoring page
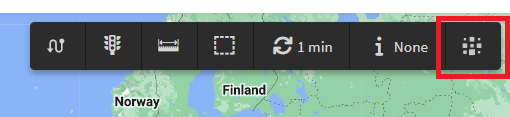
Upon clicking on it, a new monitoring page will open with different features and flexibility as shown below.
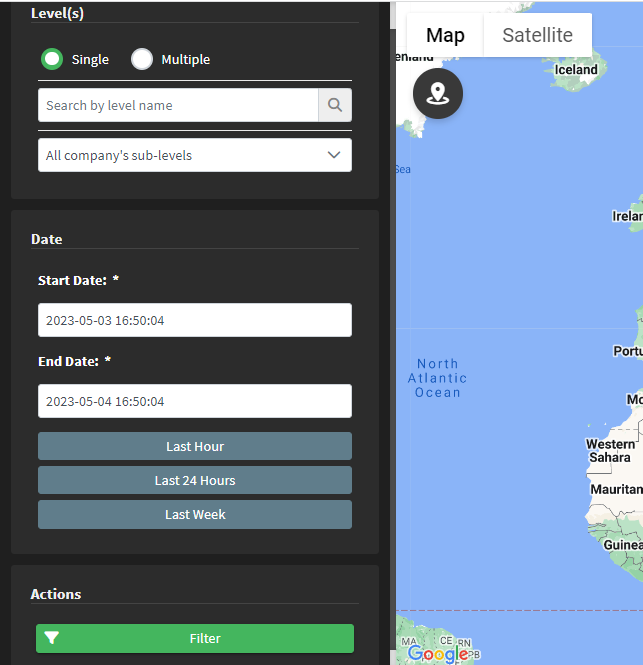
The new page is equipped with filters for the following:
- Level filter: where you can choose what vehicle(s) to whom the data will be displayed. Muli-vehicle selection is also available.
- Date filter: for date range selection. The filter is centered on the last 24 hours by default.
- Actions: to request your data once done setting your filters.
Once filtered, you’ll get the heatmap for the geographical data of the selected vehicles over the selected time range. You need to keep in mind that the heatmap uses a warm-to-cold color spectrum in which the warm areas mean values are high (number of pins/points) and the cold areas’ values are low. That is, areas of higher intensity will be colored red, and areas of lower intensity will appear green.
.png)
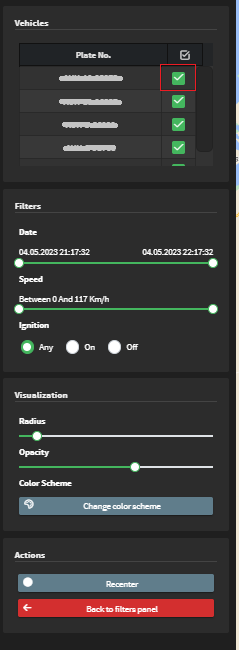
Moreover, you’ll get more filters/actions to apply directly on the map as follows:
- Show the user’s geofences on the map to double-check the vehicles’ movements against the user-defined geofences.
- Vehicles panel to enable you to hide/show any vehicle data on the map.
- Date scroll for easier date range edit. Scrolling the start/end points of this filter will have effect directly on the map.
- Speed scroll to focus your map on data with specific speed range.
- Ignition status selector for more determination.
- Radius scroll for colored points dimension editing.
- Opacity scroll for color intensity.
- Change color scheme button to change cold colors scheme.
- Recenter button to recenter the map on the default view .
- Back to filter panel button to go back to the filtering options.
- Export Explorers to PDF:
You can now export your explorers to either excel files or PDF files.