6-4-12
Release 6.4.12
1. Best Driver Report Enhancement:
We are glad to announce the new enhancements introduced to the “best driver” report. The report is basically built to show statistics on both drivers and vehicles over the selected months.
👨✈️When generating for drivers:
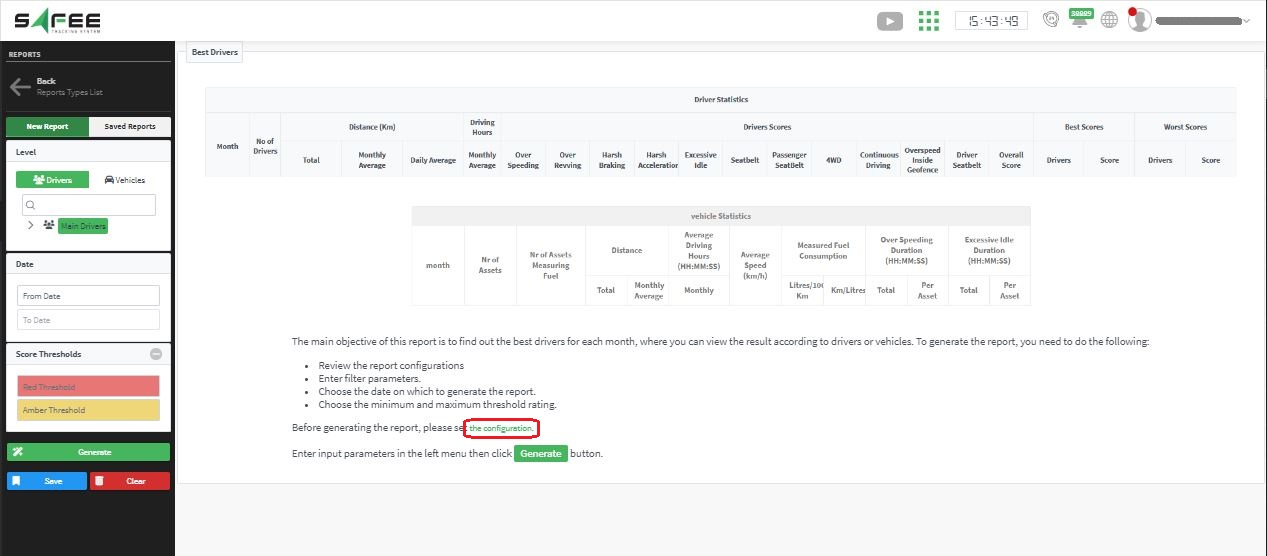
Before you can display drivers’ data, you need to set the report configurations. You can access the configurations from the report landing page as shown below:
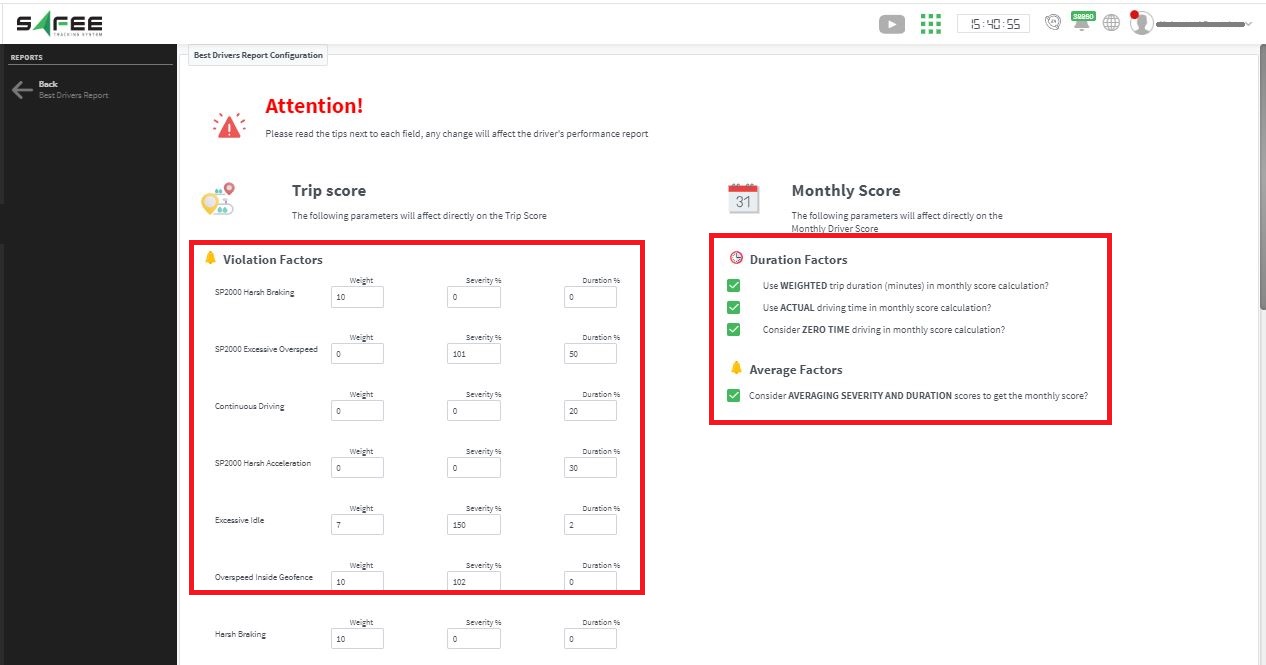
Once you click on the configuration link, you’ll have access to a set of violations that will be included in the report output. You need to determine how each of them will have an impact on the final score. The way that each field will affect the result is explained on the configuration page itself.
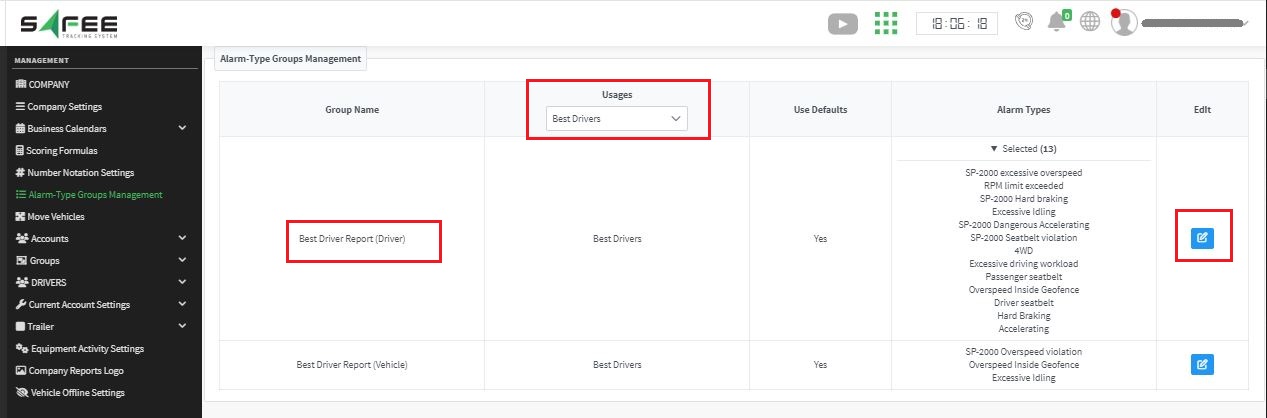
The list of violations is determined through the alarm group named “Best Driver Report (Driver)” on the “Alarm-Type Groups Management” page.
Notes to be considered when setting the report configurations:
- If you don’t need to include a violation, you may just exempt it from the alarms group on the alarm-type group management page
- If you include an alarm in the alarm list, then set all its fields to zero on the report configuration page, it won’t have a corresponding column on the report output.
- If you set the duration & severity fields to zero but the weight field to a non-zero value, the corresponding column on the output will be empty.
- You need to make sure that you already created the corresponding alarm conditions for the selected alarms as follows”
- SP-2000 excessive overspeed —> SP2000 AC
- SP-2000 Hard braking —> SP2000 AC
- SP-2000 Dangerous Accelerating —> SP2000 AC
- SP-2000 Seatbelt violation —> SP2000 AC
- RPM limit exceeded —> RPM limit AC
- Excessive Idling —> Idle Time condition AC
- 4WD —> 4WD AC
- Excessive driving workload —> Excessive driving workload AC
- Passenger seatbelt —> Passenger seatbelt AC
- Overspeed Inside Geofence —> Overspeed Inside Geofence AC
- Driver seatbelt —> Driver seatbelt AC
- Hard Braking —> Event-Based AC
- Accelerating —> Event-Based AC
Now, after all the necessary configurations are done, you are good to go to generate the report.
Just:
- Select the drivers’ group/driver name
- The target months
- Set the coloring thresholds given that scores (in the overall score column) less than the red threshold will apply a red highlight on the month row while scores greater than the red threshold and smaller than the amber threshold will apply an amber highlight on the month row. And finally, scores greater than the amber threshold will apply a green highlight on the month row.
- Generate
The report will show the statistics of all selected drivers over each month in a row, in addition to the best & worst scores recorded in that month. You can also check the names of the drivers with the best scores and those with the worst scores by clicking on the “view” button in the corresponding column. On top of that, the report has a second tab presenting a bar chart for the number of each colored driver in each month.
🚗When generating for vehicles:
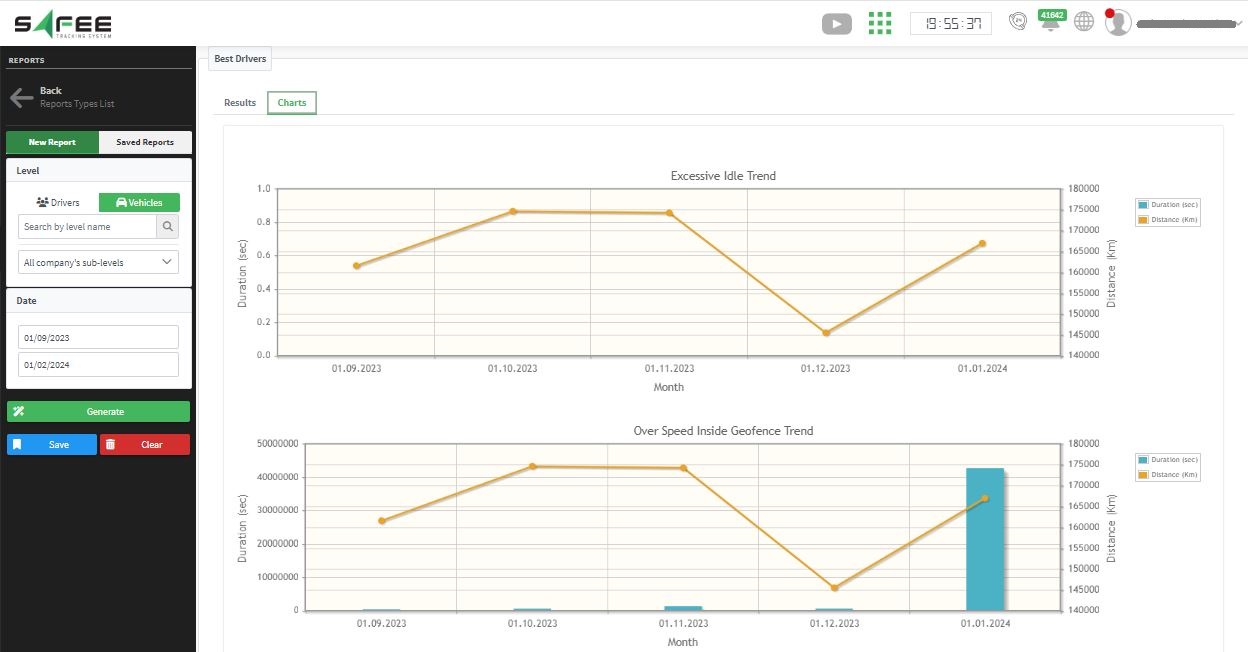
When it comes to vehicles, the report outlines some statistics about the trends of vehicle violations over the selected months. The report provides 2 tabs, the first is for the numeric results while the second is for comprehensive charts of the monthly trends.
Again, the list of violations-to-display is determined through the alarm group named “Best Driver Report (vehicle)” on the “Alarm-Type Groups Management” page.
2. Calendar mileage report enhancements:
In response to the significance of the calendar mileage report, we consistently strive to enhance this report to meet user requirements.
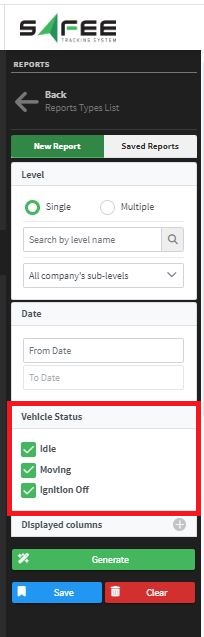
In this update, we have introduced new input options to consider vehicle status into the filtering mechanism, such as idle, moving, and ignition off. Users now have the flexibility to customize the report output based on their preferences. For example, if “moving” is selected only, then the report output will not show the vehicles which were idle all the time within the selected range.
3. Enhanced Reporting Features
In this update, we have introduced several enhancements to improve the reporting capabilities, focusing on providing users with more detailed and customizable information. The enhancements are as follows:
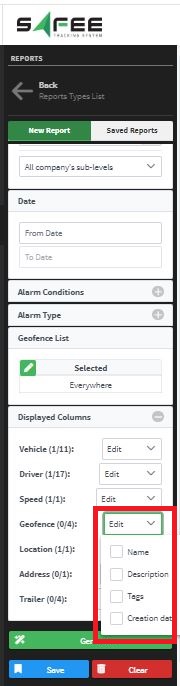
- Alarm report: Addressing the need for companies to have insight into the vehicle location when an alarm is triggered, we have incorporated more geofence attributes like the geofence description, tag, and creation date into the report input for enhanced visibility. Moreover, we opened deeper levels of the vehicle for more convenience.
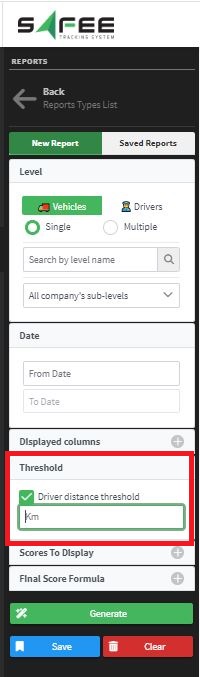
- Driver KPI report: To enhance user customization, a driver distance threshold can now be set as an input parameter for the report, providing users with more control over the information they receive.
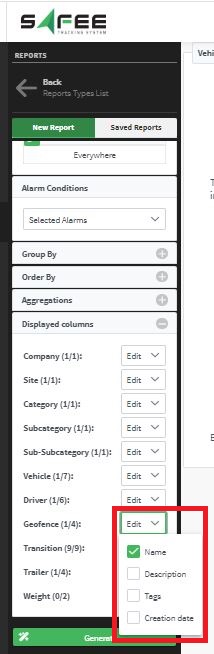
- Vehicle Geofence Movement Details report: Added the ability to show more geofences attributes like the geofence description, tag, and creation date. In addition to new filters to show the subcategory and the sub subcategory.
-
Vehicle driving dashboard: we opened 2 new vehicle attributes to be available at the report output. The new attributes are the vehicle model and the vehicle maker.