6-4-7
Release 6.4.7
In this release we introduce a new report, a new management page and a new enhancement.
- Driver KPI report:
we are thrilled to unveil the curtain of the new comprehensive report that will move your tracking experience to another level. Driver KPI report or Driver’s Key Performance Indicator report aims to give you full control over what standards your drivers should respect and how you’ll classify them according to the violations they commit.
the report is built in the most flexible, user-friendly, and easy-to-use manner to enable you to make the most of it. the delicate preparation for it has been isolated in a new page as will be described later below, so all you need to do in the report input is to straightforwardly choose from what you prepared!
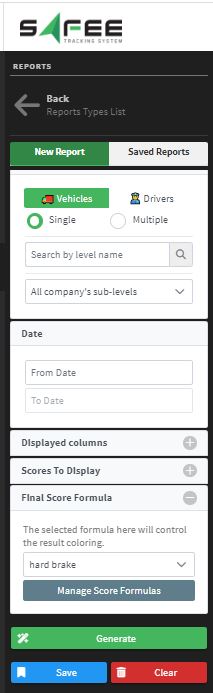
Report input:
-
Level: Select the level of your interest.
-
Date: specify the time range over which you want to calculate the scores
-
Displayed columns: Select what driver information you want to display
-
Scores to display : Select what other scores you need to show in addition to the main final score. This filter helps you to show the score of the individual violations that were included in the overall formula. That is, if your formula involves the violations related to overspeed, harsh braking, and the seatbelt buckling, you can show the score of the overspeed violation, the score of harsh braking violation, and the score of the seatbelt violation each in a separate column with the aid of this filter. All you need to do is to create a formula for each of them (with no need to any coloring set), so it appears in the list of this filter. N.B. this filter shows the final formulas only; not the sub-formulas (helping formulas)
-
Score formula: finally, the formula that will be used to calculate the final score for each driver and give him a corresponding color.
Report output:
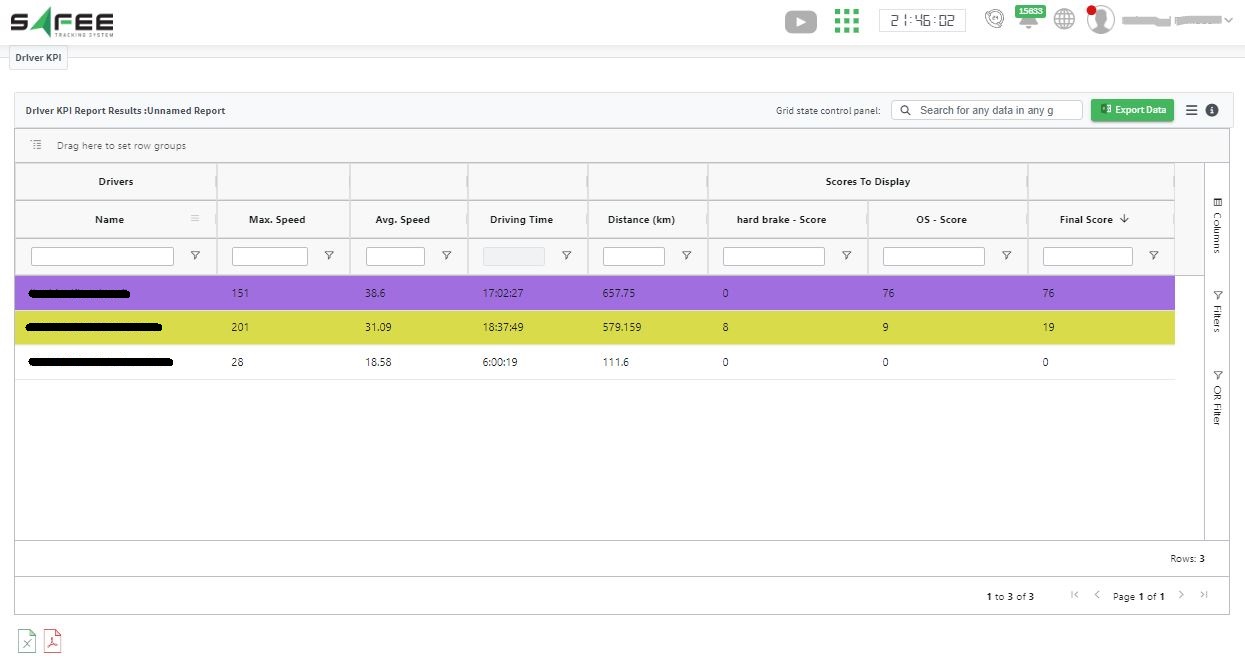
The report shows by default the following columns:
-Driver Group: the name of the group to which the driver belongs.
-
Driver Name
-
Max. Speed: the maximum speed the driver drove during the specified period
-Avg. Speed: it’s the average speed needed to travel the reported distance over the whole selected time range.
-
Driving Time: the total driving time during the selected time range
-
Distance: the total distance traveled during the selected time range
-
Final Score: the score calculated by applying the formula selected in the “Final Score Formula” filter at the report input.
In addition to the default columns (which can hide at any time through the “columns” filter in the grid view), you still can show more columns to fit your needs.
-
You can show any needed driver info by selecting it in the “displayed columns” input filter.
-
You can show any violation score by selecting its formula in the “scores to display” input filter.
Now, in the following, we’ll show you —in detail— how to create your own formula.
- Scoring Formula Management:
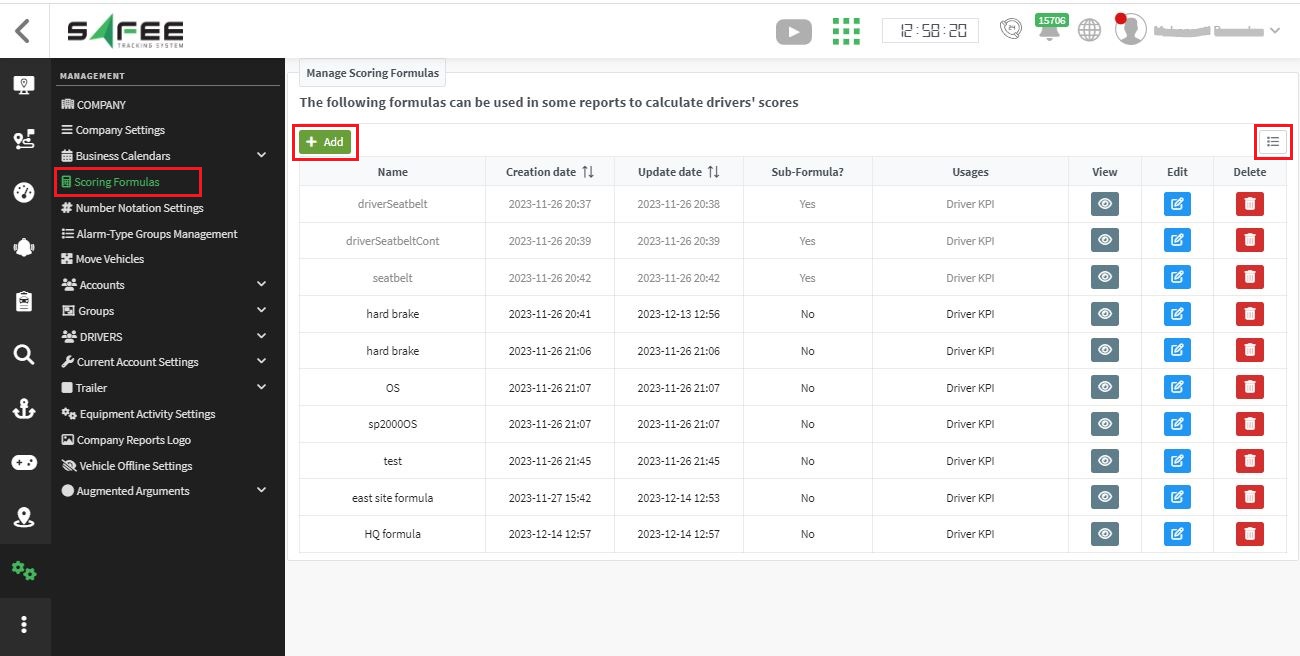
At the management tab, you find a new page “Scoring Formulas” on which you can set/edit all your formulas. This page enables you to build any formula you need based on a list of alarm types specified in the alarm-type group named “Formula Violations”. Any editing on the alarm types’ list on this page will have effect on the variables available on the “scoring formula” page as we’ll see below.
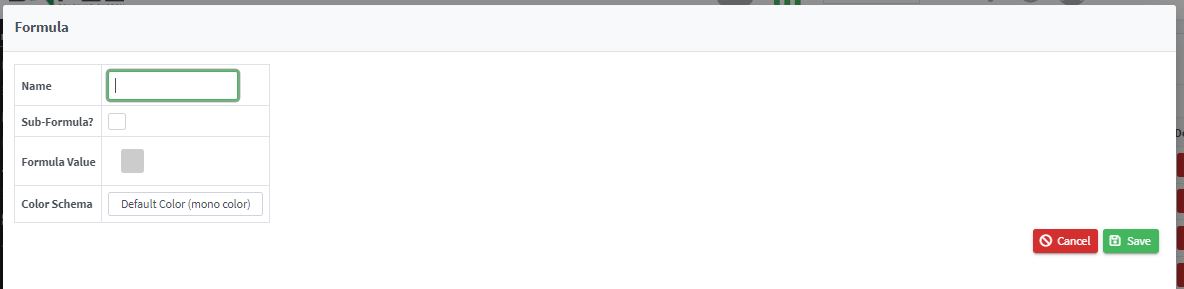
Now, to create a new formula, click on “add” button so the following popup appears, containing the following utilities.
-
Name: where you can set an appropriate name for your formula
-
Sub-Formula: upon checking this checkbox, you inform the system that you are creating a non-final formula that is aimed only at facilitating the final formula creation. Thus, you won’t be able to set any coloring scheme for it.
-
Formula Value: where you can set your formula. Let’s explain it through an example for better understanding.
Let’s assume that you need to add a formula like this:
|----------------------------------------------------------|----------------------------------------------| | Score | Where | | Score = ((total distance/total violation)/ 100) + 50 | “total violation” > 0 | | Score = 100 | “total violation” = 0 & total distance > 0 |
Where “total violation” = 0.5 * harsh braking violation count + 0.25 * seatbelt violation count.
To create such a formula we need first to create a helping sub-formula that calculates the total violation.
3.1. So, let’s begin with the “total violation” sub-formula creation.
A. In the name field, add a suitable name; let’s say “total vio”
B. Check the “Sub-Formula” checkbox
C. Then, start filling in the formula value fields like in the next steps.
D. You need to choose the plus operation first (+) from the basic operations row, this will open 2 empty fields with plus sign in between.
E. In each of the empty fields, you may choose a multiplication operation (x); this will open a new 2 empty fields with a multiplication sign in between.
F. Then, click on the first field so you can start adding what you need. In our example, after clicking on the first field, choose the “Number” option to enter the first constant in our equation which is “0.5”. Then, click on the second field and from the “variables” row choose the appropriate harsh braking alarm type.
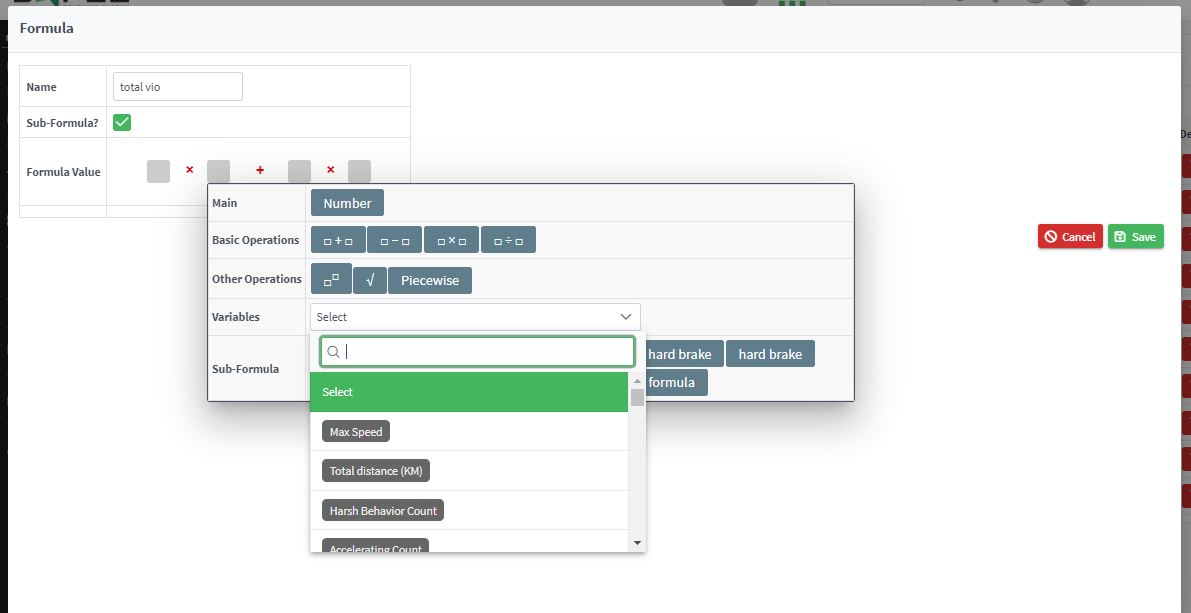
G. Keep filling the fields until you get the “total violation” sub-formula and save your work.
H. After saving this sub-formula, it’ll appear in the row named “sub-formula” so you can choose it when creating the final formula.
3.2. now, after the needed sub-formula is ready, you are good to go to create your final formula. Click on the “add” button and give it a suitable name.
-
then, in the “Formula Value”, you need to choose from “other operation” the operator named “piecewise”.
-
you’ll get a matrix-like form, and you start filling the first field with the formula operations as follows.
-
choose the plus operation first (+) from the basic operations row, this will open 2 empty fields with plus sign in between. In the first field, choose a division operation and set the “total distance” variable as its numerator. In the denominator, choose a multiplication operation and insert the number 100 in the first field and the “total vio” sub-formula you created earlier in the second field.
-
at the other side of the (+) operation, choose to add a number and insert the constant “50” that you have in the above-mentioned formula.
-
now, to apply a condition on this formula, go to the field after the word “when” and click in it.
-
you’ll get more mathematical operations; choose the (>) operation.
-
at the first field set the “total vio” sub-formula and at the other side of this comparison set the number “0”
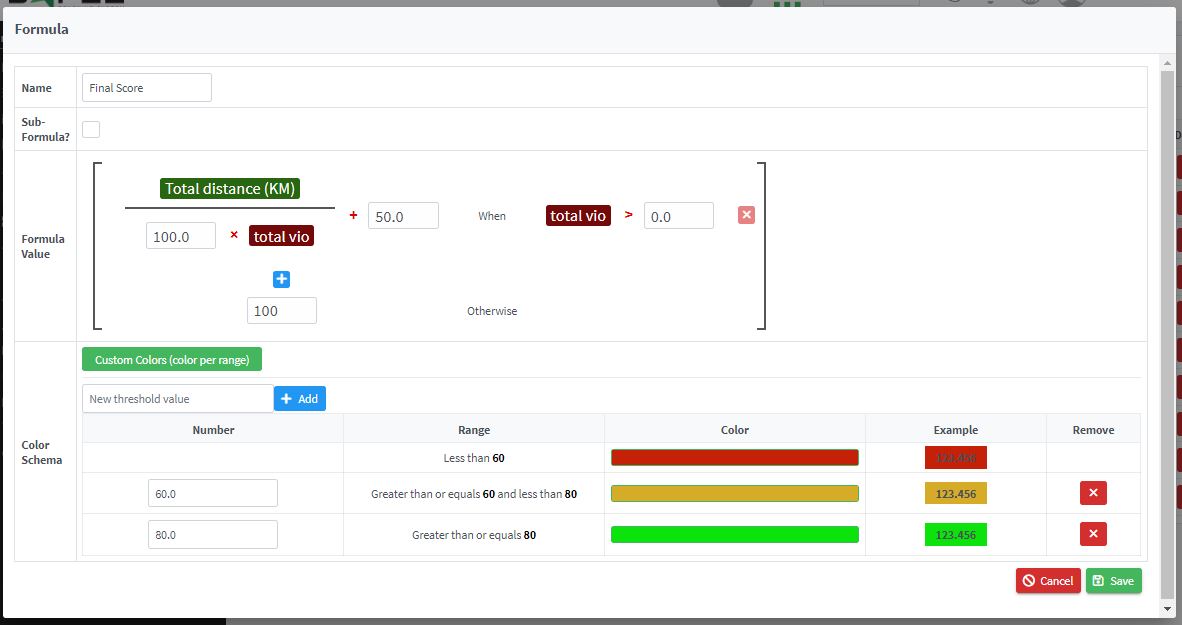
- finally, after finishing the formula value, you are good to go to editing the coloring scheme as suits you. All you need to do is to set the target threshold, click on add, then choose the corresponding color, and so on.
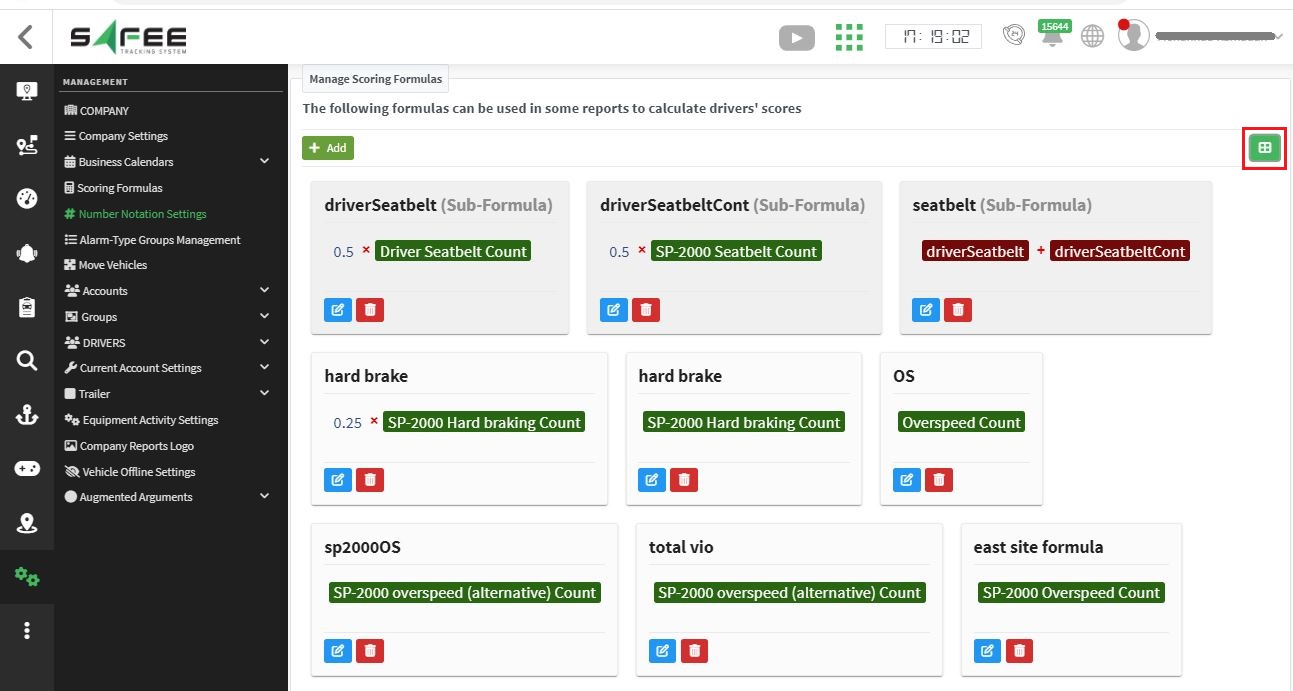
After clicking on “save” button, you’ll be redirected to the “Scoring Formula” again to show the list of formulas that you created. It is good to mention here that you can display the formulas in either form, table view, or grid view via the grid button on the top of the table.
- Maintenance Enhancements:
Continuing our persistent enhancement to our maintenance feature, we are glad to announce adding the following new improvements:
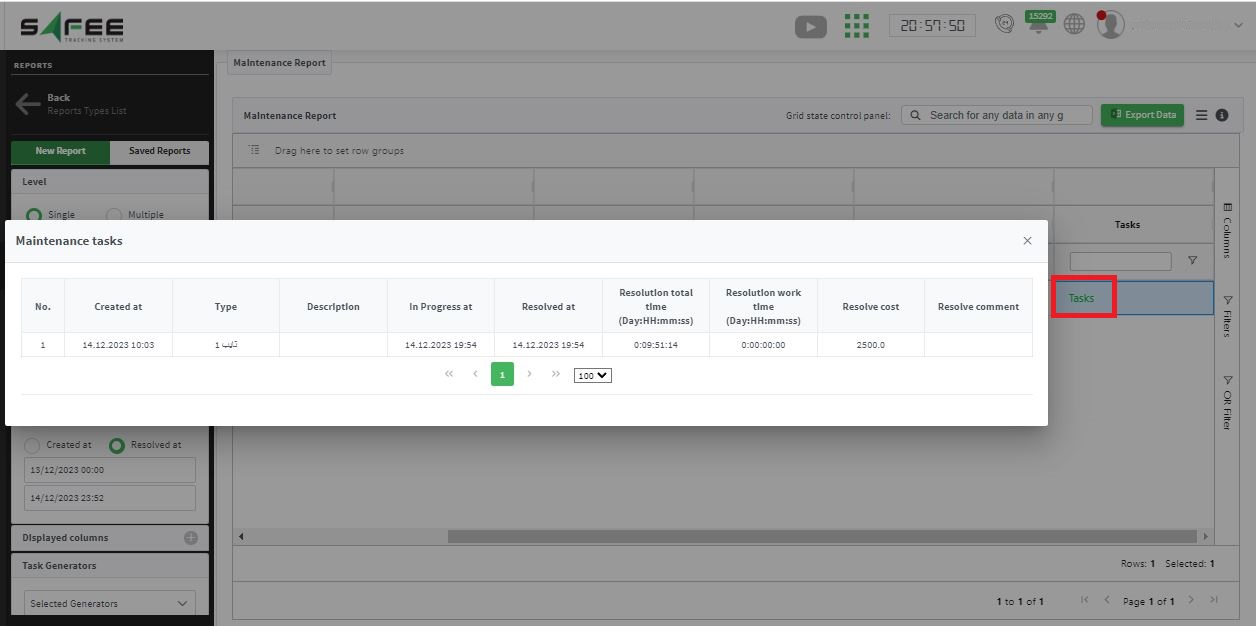
- Maintenance tasks report:
The report’s output is limited now to the vehicles with maintenance tasks, as vehicles with no maintenance tasks will not appear in the report’s output. Moreover, we added a new column that displays all tasks for each vehicle with further details on each one.
- Maintenance tasks explorer:
Upon resolving a periodic task, you can now know when the next due will occur directly from the resolve popup as shown below:
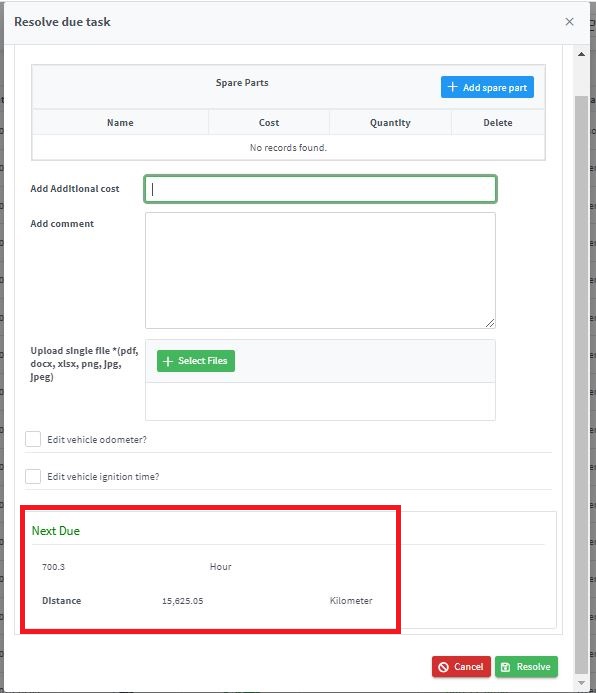
Next due information are one or more of the three conditions, according to the related task generator constraint type:
-
Vehicle Odometer
-
Vehicle Ignition Time
-
Time
- New Device Added:
We are glad to announce that we added Teltonika FMC003 device to our family.